Achieving Operational
Excellence in your
Operating Room
Your OR is vital to your hospital. It transforms the lives of the patients you serve. It also serves as a pivotal revenue driver—enhancing your overall financial viability. Creating a more efficient OR comes down to optimizing how you operate. Successfully achieving this takes three key components—visibility, collaboration, and implementation.
VISIBILITY: IDENTIFYING THE OPPORTUNITIES
Reviewing daily case volume, variability, and staffing ratios. Evaluating your entire care team’s utilization. Identifying block issues and delayed starts. It’s this type of granular analysis that can give you a better overall understanding of your day-to-day operation.
Uncovering these insights requires the right technology and analytics. Partnering with a national practice like US Anesthesia Partners (USAP) can help. As the industry leader in anesthesia care, we have both the clinical expertise and proprietary technology needed to monitor the performance of your OR. You’ll benefit from our ability to:
- Observe and evaluate the current operating model focusing on the pain points and opportunities
- Provide visibility and performance benchmarking through proprietary tools that illuminate key data for comparisons at the facility, region and health system level
- Establish a multi-phase strategic improvement plan to reach maximum optimization and efficiency
USAP’s Proprietary tools provide insights on OR utilization and potential growth by extracting clinical quality and anesthesia billing data. The data is swept every 15 minutes and allows USAP to review the efficiency of our staffing, scheduling, and overall OR performance. Transparent and easy to read, USAP’s tools can diagnose issues with start times, turnovers, flip rooms, blocks, surgeon accountability and more.
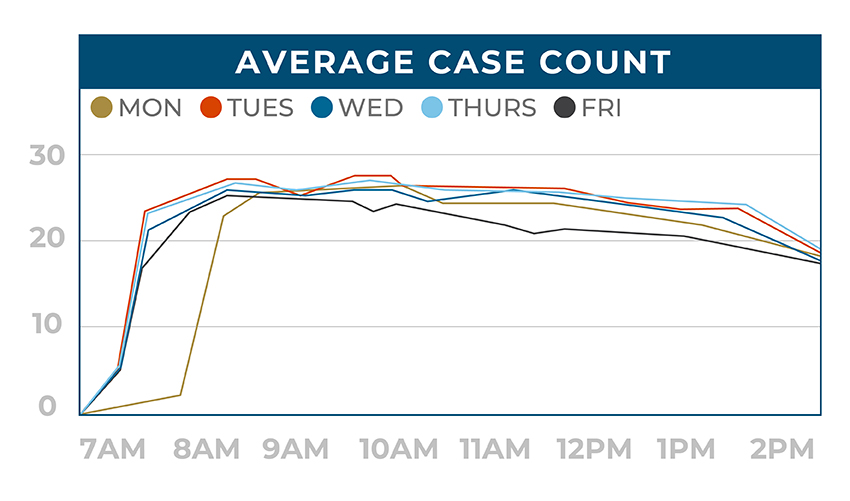
USAP’s propriety OR operation tool reports on the operating room start time, daily case volume, and clinician utilization throughout the day. On-demand data review and visualization allow for identification of opportunities to efficiently increase capacity or reduce costs. Shown here, the X axis is the time of day, and the Y axis represents the number of cases running simultaneously throughout the OR and offsite locations. This allows for quantification of the demand for sites of service by time of day and provides insight into start times, block utilization, case scheduling, and after-hours work. A perfect operating room scenario would show an immediate and sharp vertical line indicating the efficient start of morning cases as well as an even horizontal line to the right showing consistent OR utilization. Each day of the week should be similar.
COLLABORATION: PARTNERING FOR EXTRAORDINARY CARE
USAP is committed to partnering with hospital leadership. We share the same goals: optimize our staff and schedules to improve OR throughput, identify efficiencies to reduce cost and provide the highest quality care to patients. We are uniquely aligned for success. Local physician leadership, USAP Anesthesia Site Chiefs, and clinical operation experts collaborate with Perioperative Management to build a multi-tiered, multi-phased approach for hospital executives. This arms you with the ability to choose which optimization and efficiency levers to pull. Our propriety benchmarking and clinical operations efficiency tools provide insights, and our optimization experts offer best practices.
Creating alignment across your care team is critical to realizing effective change. In order to achieve that, you need a singular source for the communication and collaboration to occur. That’s where our clinical operations experts come in. At USAP, we provide ongoing consultation which allows us to:
- Review OR performance metrics and identify opportunities
- Effectively collaborate to localize and implement national best practices to meet operational goals
- Align on optimization and efficiency goals
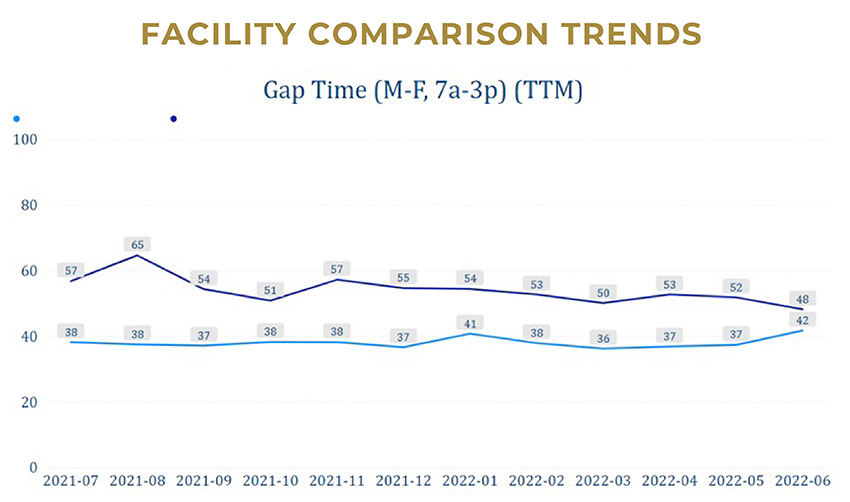
Shown to the right, USAP’s propriety benchmarking tool provides a summary of key metrics. It allows for benchmarking across variables such as facility size, heath system, and region. Compare your facility’s gap time today against last year, or against other facilities in your region. Evaluate and track the impact of operational changes implemented in your ORs by assessing key metrics over time. USAP provides useful, actionable, and transparent insights.
IMPLEMENTATION: REALIZING YOUR EFFICIENCIES
Insights and plans are great, but without successful implementation, there are no realized benefits. That’s why we are committed to work with you to develop and successfully put informed plans and protocols in motion, enabling you to begin realizing key operational efficiencies.
What does success look like? That depends on your organization’s goals. Here are a few key indicators.
- Gap Time Decrease turnover time between cases
- Morning Start Time Dependable, consistent OR starts
- OR Concurrency Identify staffing needs and scheduling opportunities
- Clinician Utilization Increase clinical OR time